Building an AWStats-Style Log Analyzer in Rust
At first glance, a web log analyzer sounds like a weekend project. Read a line, parse an IP address and a URL, increment a counter, and put the result into an HTML table.
That description holds up until the first log rotation, the first slightly unusual Apache format, or the first attempt to update yesterday's report without counting yesterday's requests again. It gets more interesting when the analyzer needs to survive a misbehaving native plugin.
Those are the problems I ended up working through while building Stats, an experimental, AWStats-style web log analyzer in Rust. I recently published v0.1.2. This is a look at the design choices and the work behind that release, including the parts that were less straightforward than the initial parser.
Why revisit AWStats-style log analysis?
In November 2025, the maintainers of AWStats announced that the project was deprecated and no longer actively developed. AWStats has a long history, and its author, Laurent Destailleur, deserves credit for maintaining it for so many years. The upstream notice recommends Matomo Log Analytics as a supported migration destination.
I didn't set out to argue against that recommendation. But the announcement brought a different question to mind: what would a smaller, Rust-based implementation of selected AWStats workflows look like today?
There are still situations where parsing access logs locally is useful. You may want reports without adding JavaScript to a site, or you may already have log files and a scheduled job that generates HTML. A local analyzer can also be operated without introducing an external analytics service. None of that makes it automatically more private or more accurate: the logs themselves, the derived identifiers, and how long they are retained still matter.
The aim for Stats is deliberately narrower than “replace AWStats.” It is an independent implementation of some familiar configuration and reporting workflows, with explicit boundaries around what it can and cannot reproduce. It is not a fork, an official successor, or a drop-in replacement.
Compatibility is a feature with a boundary
Stats understands an AWStats-style Key=Value configuration and supports several log-format families: Apache and Nginx custom formats, common access-log records, JSON-line input, Unix timestamps, and selected AWStats time formats. Optional time-zone normalization and MaxMind Country, City, and ASN databases are supported.
That sounds like a broad list, but names are not the same as behavior. Accepting a directive does not mean reproducing all of AWStats' semantics. Some presentation-only directives are accepted without changing output; unsupported directives are reported through validation diagnostics. Stats also does not read AWStats' original historical databases.
I prefer documenting that distinction to silently promising compatibility. If two tools both show a “visits” column, it is tempting to assume that the underlying counting rules are identical. They may not be. Visit and bot classifications include approximations; log formats, time zones, and session heuristics all affect the numbers.
The compatibility matrix is therefore part of the product, not a footnote. It identifies supported behavior and known differences, so a prospective user can make an informed decision before migrating anything.
The pipeline: parse once, report in several ways
I split the implementation into a Cargo workspace rather than putting ingestion, storage, and presentation into one binary. The workspace has twelve packages. stats-core handles parsing, normalized events, enrichment, storage, and report queries. stats-cli coordinates command-line operations. There are also HTTP and CGI adapters, a terminal UI, and separate renderer plugins.
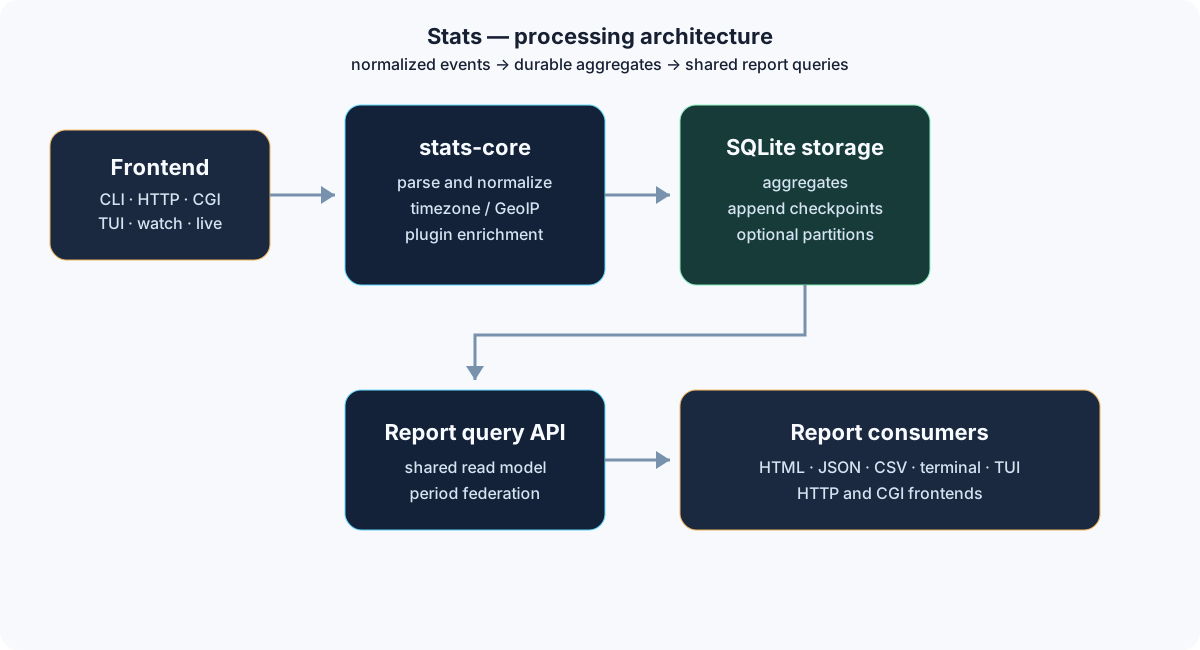
The shared query layer keeps presentation code away from the details of SQLite storage.
The path is reasonably simple:
- Read configuration and select an input log.
- Parse records and normalize event fields.
- Apply configured time-zone, GeoIP, and event-enrichment behavior.
- Update SQLite aggregates and ingestion checkpoints.
- Read report data through the shared query API.
- Produce static HTML, terminal output, or responses through the available frontends and configured renderers.
The shared query API is one of the more useful separations. The terminal summary, TUI, and HTML report should not each invent their own interpretation of stored aggregates. The presentation layer can change without rewriting ingestion or the storage schema.
HTML is a static, multi-page report by default; an HTTP or CGI frontend can also read existing data. Optional external renderers produce HTML, JSON, or CSV when configured. These are distinct execution paths, not features that every binary automatically bundles.
Log rotation is where simple counters stop being simple
The natural first implementation of an analyzer is to read a file from the beginning. That is fine for a one-off report. It is not fine for a scheduled job on a busy website.
Stats' normal update command is cumulative. It processes unseen input and retains its existing aggregates. To decide whether a previously processed range can be trusted, the updater uses checkpoints tied to the source file's identity and content. A replacement, truncation, or changed processed prefix must not be treated as an ordinary append.
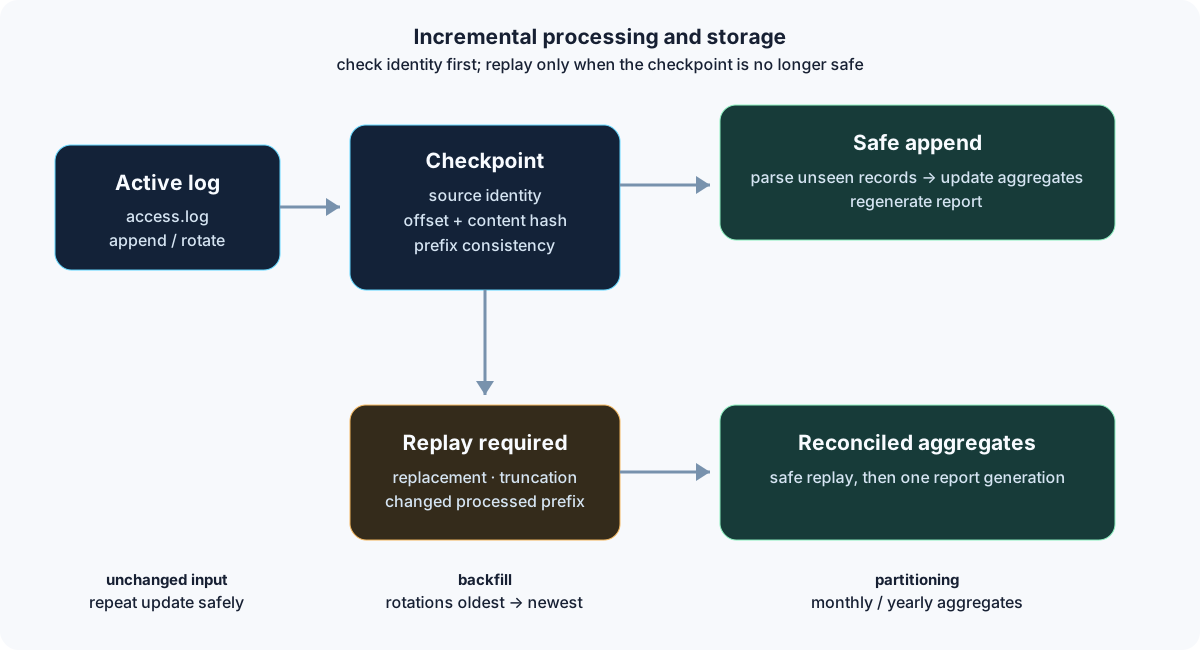
An ordinary update follows the active log. Historical imports are an explicit operation.
There are two cases worth keeping separate:
The daily update. Read the configured active log, use the checkpoint where valid, and add new events. A normal update does not go hunting through all of the rotated archives in the directory.
Historical backfill. When I explicitly want to import existing history, backfill discovers conventional numbered rotations such as access.log.1 and compressed archives like .2.gz, .3.bz2, or .4.xz. It processes them oldest to newest. Individual files can also be supplied explicitly.
Keeping those operations distinct matters. Running backfill on every timer tick may repeatedly open old archives, while using rebuild during a multi-file import would intentionally clear derived aggregates. Neither is the same thing as an incremental update.
There is also a practical boundary to the guarantee: checkpointing protects against specific file changes and repeated unchanged input. It is not a claim of a distributed, exactly-once event-processing system. An administrator still needs a sensible rotation schedule, readable archives, and a backup strategy.
Why SQLite, and what I gave up
The default storage layout uses one SQLite database for aggregate data and processing state. That choice suits a local analyzer: the state is on disk, inspectable, and does not require another server just to run a scheduled analysis job.
The implementation uses write-ahead logging (WAL), a busy timeout, and explicit maintenance commands. SQLite still has concurrency and operational constraints; choosing it does not make every update or migration free of cost.
For longer histories, Stats supports monthly or yearly partitions. The control database remains under DirData/stats.sqlite3; event aggregates live in period-specific databases under DirData/periods/. Queries can combine the period data for reports, while shared control and session state remains in one place.
The trade-off is that cross-period reporting becomes more involved, and late or out-of-order events make some session-derived metrics approximate. I would rather surface that than present a “unique visits” number as if it were directly observed.
There are explicit backup, optimize, storage, retention, and migrate operations. Retention lists matching partitions before removing anything, can archive them, and requires an additional removal option to delete original partitions. Migration from the old single-database layout creates a backup before clearing and rebuilding derived aggregates. Those are operational decisions, not just database implementation details.
One less obvious detail is privacy. Stats does not store raw client IP addresses as visit identifiers, but the deterministic FNV-1a aggregation keys are pseudonymous, not cryptographic anonymization. They still deserve protection as analytics data. A log analyzer is not automatically privacy-safe just because it runs on your own machine.
Native plugins need two different conversations
Extensibility was another area where the easy implementation and the safe-enough implementation diverged.
Stats supports native event enrichment and external report rendering, but the execution models differ significantly.
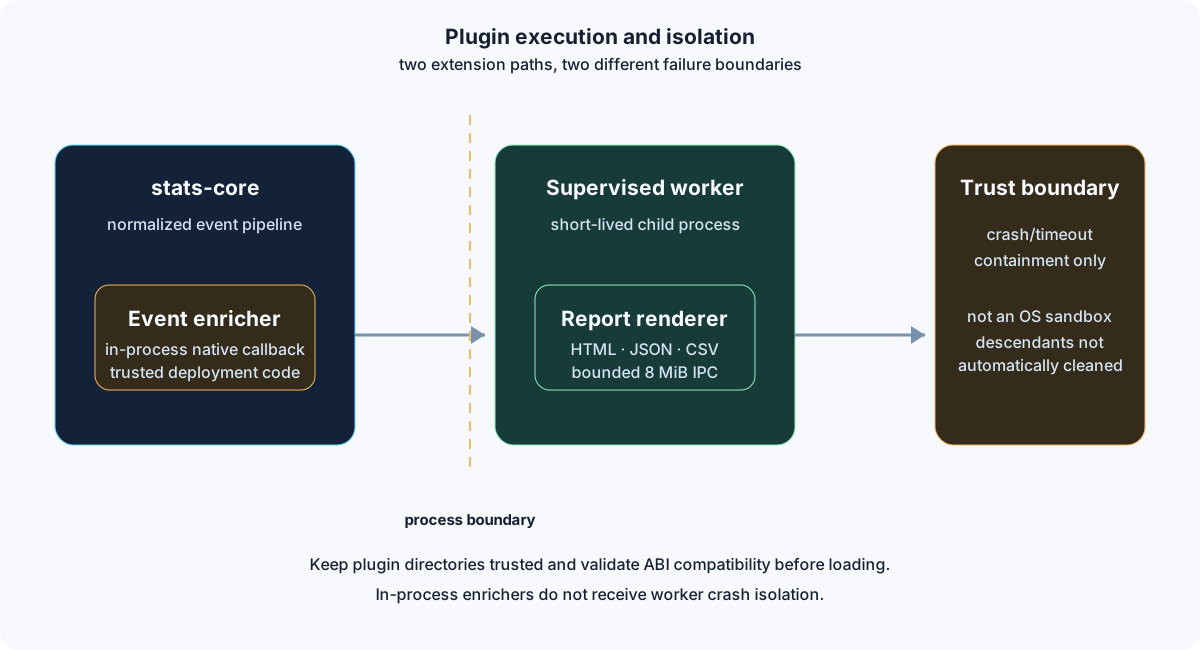
The worker boundary helps contain crashes. It is not a sandbox for untrusted code.
An event-enrichment plugin executes in the analyzer's process. It works with normalized fields such as the client address, method, URL, status, and byte count. Since it is native code running in-process, a bug in that callback can affect the analyzer. It must be treated as trusted deployment code.
An external report-renderer plugin goes through a short-lived supervised worker process. Requests and responses are limited to 8 MiB. The supervisor handles failures such as non-zero exits, aborts, segmentation faults, malformed or oversized responses, and timeouts. A failed rendering request can return a controlled error instead of taking down the CLI, HTTP, or CGI frontend.
That is useful fault containment, but there are limits. The worker retains its operating-system privileges. It can access files allowed to that account and may spawn other processes; independently spawned descendants are not automatically cleaned up. There is no claim of OS-level sandboxing or safe execution of arbitrary third-party binaries.
I think this distinction is worth spelling out because “runs in another process” can sound stronger than it is. It solves some failure modes. It does not solve the entire trust problem.
Getting from tests to a release
The project did not go straight from “compiles locally” to a clean public release. I had to spend time debugging timeouts and other issues during testing and CI. I am intentionally not assigning causes to individual earlier failures here without their corresponding logs and fixes in front of me; a final green workflow does not explain every failed run that came before it.
What the final runs do establish is more concrete.
For the v0.1.2 release commit (d09f0bb), the GitHub Actions checks completed formatting, workspace checking, 123 passing tests, and Clippy with warnings treated as errors. The CI run also completed a dependency audit and produced a Linux release bundle. The separate release workflow repeated the core Rust checks and tests, built the optimized binary, packaged it, and verified the archive checksum.
The worker tests are particularly relevant to the architecture discussion. They cover direct worker failure scenarios including abort, SIGSEGV, invalid replies, oversized messages, and timeouts; additional tests check that CLI, HTTP, and CGI requests fail in a controlled way and that subsequent requests can succeed. That is much stronger evidence for the worker boundary than a diagram alone.
The published workflow also confirmed that softprops/action-gh-release uploaded both stats-0.1.2-linux-x86_64.tar.gz and the corresponding .sha256 file to the existing GitHub Release. The checksum verification passed before upload. This is a real release artifact, not just an Actions artifact hidden in a CI run.
There are still things that result does not prove. The supplied release log does not show an independent clean-machine installation and end-to-end smoke test of the downloaded archive. Nor does passing the worker fault tests make arbitrary native plugins safe. I prefer to keep the evidence at the level of what was actually exercised.
The Linux bundle includes the analyzer binary and deployment materials. Optional dynamic HTML, JSON, and CSV renderer libraries are not included and must be built or installed separately when needed. That detail belongs in the deployment documentation, because “the archive built successfully” and “every optional plugin is shipped” are two different statements.
The CI run, release page, and deployment instructions make the verification trail available to anyone who wants to inspect it.
What works today, and what I am not claiming
At v0.1.2, Stats has implemented parsing and validation for a documented subset of log formats and AWStats-style configuration, incremental SQLite aggregation, optional period partitioning, several reporting frontends, optional GeoIP data, and a native renderer plugin path with tested worker failure handling.
It is still experimental. There is no promise of full AWStats directive coverage, identical historical statistics, drop-in database migration, a stable public plugin API, or production suitability for every deployment. This is also not a speed comparison against AWStats or other analytics systems; I have not presented a reproducible benchmark that would justify one.
A useful next step is to exercise the packaged binary in a clean installation, validate reports against representative real-world log samples, and continue making the compatibility boundaries more explicit. Those are more valuable than adding another unchecked claim to the README.
What I took away
The parser was the obvious part of the project. The less obvious work was deciding what to do when the input changes underneath you, keeping historical data understandable, and making plugin failures predictable enough that a report request does not take down its frontend.
The release process added another lesson: tests and packaging are not a formality at the end. Debugging them is part of implementing the system. A green workflow is useful evidence, but it is a snapshot of the checks that actually ran, not a certificate that nothing else can fail.
For me, Stats is most interesting as a collection of those boundaries: compatibility without pretending to be identical, incremental processing without promising magic, and process isolation without calling it a security sandbox.
The source is available under GPL-3.0-or-later at avkghost/stats. If you want to try the example log, the getting-started guide documents the commands and the compatibility matrix explains what to expect.